





Intelligent Hosting with AI
The Profit Pilot Dashboard: Full Transparency Into the Real-Time Management of Your Portfolio

In 2026, the short-term rental industry faces a decisive challenge: as market dynamics grow ever more complex – in January 2026, average demand fell by nearly 8% year over year – many professional hosts lack the time and the know-how to respond to these changes in real time.
The result? They spot problems only when it's too late. They optimize based on outdated information. And they spend more time analyzing data than running their core business.
This is exactly where Arbio comes in. We take over the complete management of your revenue – from pricing to campaigns to portal optimization. And the Profit Pilot Dashboard gives you something that's rare in this industry: full transparency into how we work with real-time data to drive your success.
The Problem With Traditional Property Management
Most property management providers operate on a simple principle: they manage your properties and send you a report at the end of the month.
You see:
- How much revenue was generated
- What costs were incurred
- Maybe a few basic KPIs like occupancy
What you do NOT see:
- Why certain decisions were made
- How the team responded to market changes
- Which optimizations are running
- Whether you're on track for your goals
You're flying blind. You have to trust that good work is being done – but you can't see it.
The Arbio Approach: We Steer, You See Everything
Our approach is fundamentally different:
We take over the management of your revenue – you don't have to worry about a thing. No manual pricing, no campaign planning, no portal optimization. Our team handles all of it for you, with AI support.
But: at any time, you have full transparency into what we're doing and why.
The Profit Pilot Dashboard is your window into our work. It shows you in real time:
- How your portfolio is performing
- What decisions our AI is making
- How our team is responding to market changes
- Where we're optimizing right now
You're not behind the wheel – but you can see exactly where the journey is headed.
The Profit Pilot Dashboard: 4 Perspectives on Our Work
1. Performance Tracking: See How We Perform for You
What the dashboard shows:
- Revenue performance compared to your targets (in real time, not at month-end)
- Property-by-property breakdown: which properties are running above/below expectations
- Key metrics at a glance: ADR, occupancy rate, RevPAR, booking lead time
- Forecast: are we moving in the right direction?
What this means for you:You don't have to wait until the end of the month to know whether everything is on track. You can see today whether your portfolio is on track. And when we detect deviations, you see how we steer against them – in real time.
A practical example:On January 10, you see in the dashboard: your Berlin apartment has only 45% occupancy for February, while Hamburg is at 78%.
What you do NOT have to do: adjust prices yourself, launch campaigns, optimize LOS.
What you see: how our team responds immediately – a price adjustment is running, a targeted campaign is live, the minimum length of stay has been optimized. And three days later: Berlin climbs to 62% forward occupancy.
You see the problem AND the solution – without having to lift a finger yourself.
2. Agentic Pricing Transparency: See Our AI at Work
What the dashboard shows:
- Live price development over time and across properties
- AI decisions with reasoning: why was this price chosen?
- Impact visualization: how do our pricing decisions affect occupancy?
- Coming soon: market comparison: how do we position you vs. your comp set?
What this means for you:You understand why your property costs €120 today and €95 tomorrow. You see that these aren't arbitrary decisions, but AI-driven optimizations based on live market data.
A practical example:On Tuesday, the dashboard shows you:
- "Weak demand detected for next week. Our AI has responded:
- Minimum length of stay lowered from 3 to 2 nights
- Price slightly adjusted (€130 → €122)
- Property is now being pushed harder on Booking.com
- Expected booking probability: +40%
You see the strategy. You understand the logic. You don't have to do anything.
Three days later, the booking comes in – and you see in the dashboard that our forecast was right.
3. Forward Forecast: See How We Think Ahead
What the dashboard shows:
- 6-month outlook on booking levels and expected revenue
- Gap analysis: where do we detect potential vacancies?
- Early warning system: which periods are we watching especially closely?
- Coming soon: action preview: what are we planning to close the gaps?
What this means for you:You see not only what's happening today – but also how we're planning for the future. Which periods are we watching critically? Where do we launch campaigns early? When do we optimize prices proactively?
A practical example:It's February. The dashboard shows you:
- June forward occupancy: 35% (market: 55%)Status: under observationPlanned measures:
- Early-bird campaign starts in 2 weeks
- Pricing strategy will shift to mid-range from March
- Expected occupancy at end of March: 58%
You don't have to research, plan, and execute yourself. You simply see that we're doing it – and on time, not in May with panic discounts.
4. AI Performance Chat: Ask Whatever You Want to Know
What the dashboard offers:
Ask questions in natural language – the dashboard answers instantly:
- "Why is Berlin performing worse than Hamburg?"
- "What measures have you planned for Q2?"
- "Show me all optimizations from the last 30 days"
- "Which properties have the lowest forward occupancy?"
What this means for you:You don't have to wait for monthly reports or call us to get answers. Within seconds, you get deep insights into our work – exactly the information you need in that moment.
A practical example:On Wednesday you ask: "Why is occupancy in Munich lower than in Hamburg?"
The dashboard answers instantly:*"Munich is at 62% occupancy (Hamburg: 78%). Main reasons:
- Higher competitive pressure: +12% new listings since Q4
- Weaker corporate demand in January (-18% vs. prior year)
- Our response: pricing adjusted by 8%, mid-week campaign running since Monday
- Forecast: catching up to 72% by end of February"*
You understand the situation immediately – without having to wait for a meeting or a report.
What the Dashboard Is NOT
Important to understand: the Profit Pilot Dashboard is not a self-service tool.
It is NOT a tool with which you have to change prices, start campaigns, or adjust strategies yourself.
It is a transparency window into our work.
The difference:
- Self-service tool: Gives you data + recommendations → you have to implement them
- Profit Pilot Dashboard: Shows you what we do for you → you understand our work
You're not behind the wheel. Nor are there two sets of controls (you + us).
We drive. You see the route in real time.
The Data Foundation: Why Our Transparency Is So Valuable
A dashboard can only be as good as the data it's based on. Here's why our transparency is worth more than at other providers:
Proprietary data from 1,200+ properties:While other property managers rely only on public market data or gut feeling, we additionally work with real-time data from our own portfolio:
- Granular cost data (actual cleaning costs, energy consumption, wear and tear)
- Real booking-behavior data across all portals
- Competitive intelligence with greater accuracy
- Historical performance data with context (events, weather, market conditions)
The result: When you see in your dashboard that we're making a decision, it's not based on guesswork or outdated benchmarks. It's based on the most precise data foundation in the industry.
That's the difference between "We adjusted the price" and "Based on 1,000 similar situations from our portfolio, we adjusted the price – with an 87% probability of success."
Upcoming Features: Even Deeper Insights
The Profit Pilot Dashboard is continuously evolving.
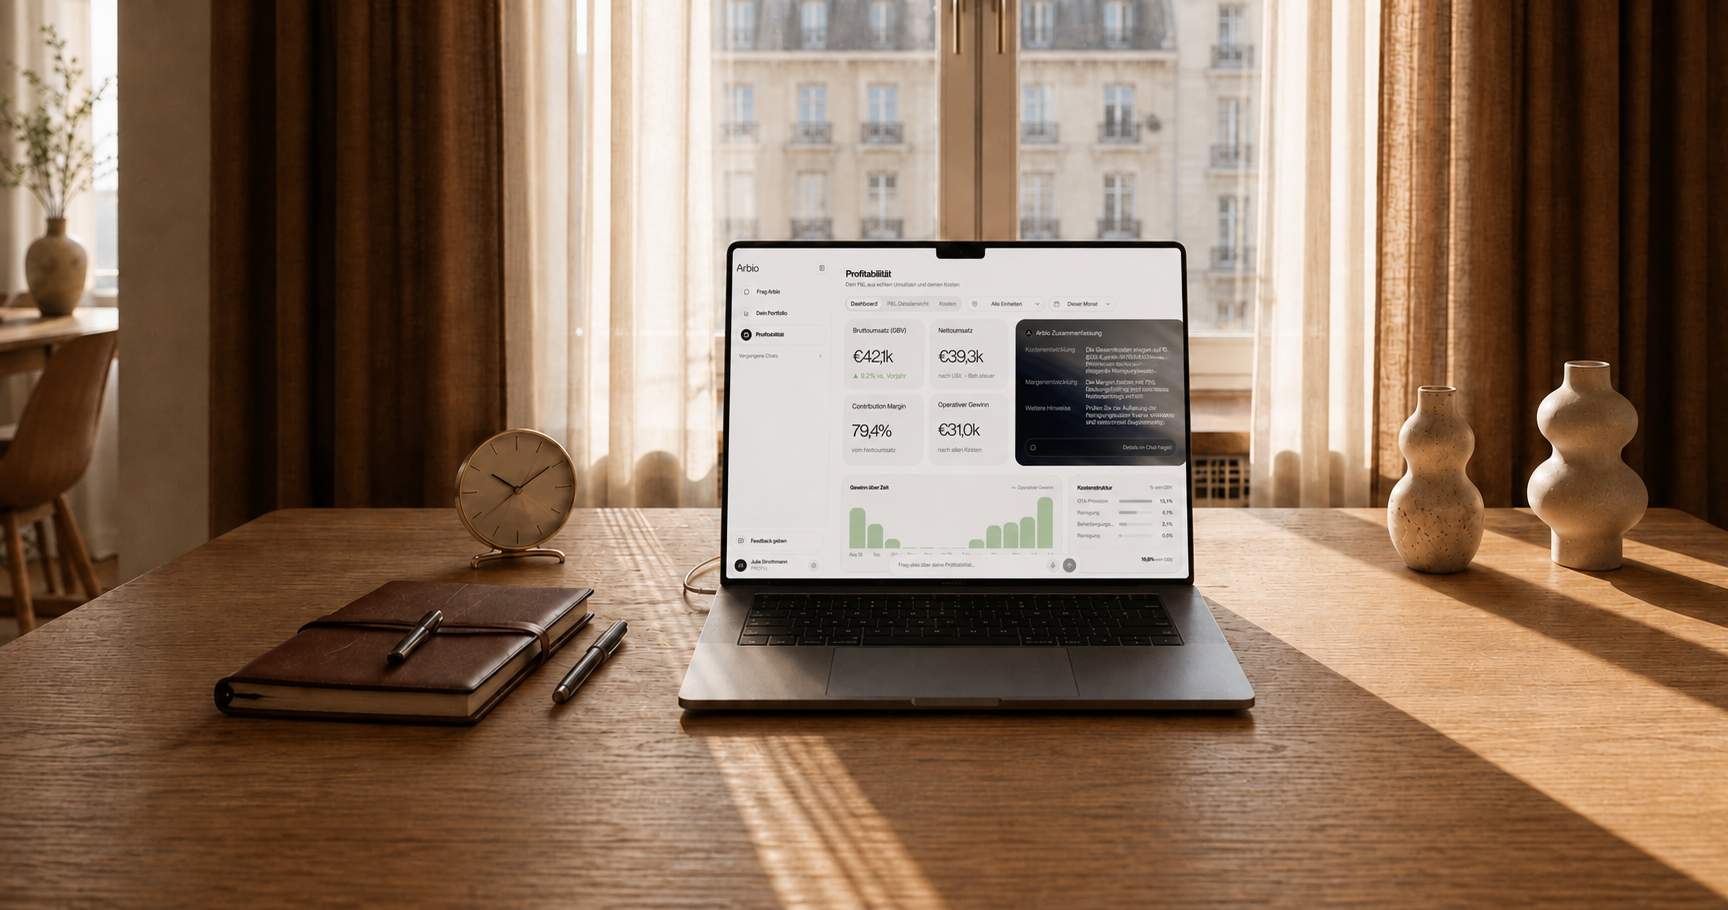
Profitability Dashboard (Coming Soon)
We go a step further than revenue tracking. The Profitability Dashboard shows in real time:
- Actual profit margin after all variable operating costs
- Contribution margin per apartment
- Cost-per-booking analysis
- Profitability ranking of your properties
- Where we see potential for cost optimization
Not just "How much revenue are we making?" – but "How much profit really remains, and how do we optimize it?"
Who Is This Approach Made For?
The Profit Pilot model (we steer, you have transparency) is built for owners who:
✅ Own 5+ properties and have no time for day-to-day management
✅ Want professional management but don't want to fly blind
✅ Want to combine trust + control: trust in our work, control through transparency
✅ Aim for maximum profitability without getting lost in the details themselves
✅ Want to use their time for strategic decisions, not operational tasks
If you currently work with a property manager who only sends you a PDF report at the end of the month, you'll feel the difference immediately.
The Difference in Practice: A Typical Month
Let's get concrete. Here's what a month with Profit Pilot looks like vs. traditional property management:
Traditional property management:
- Days 1-28: You hear nothing. Probably everything's running? Hopefully?
- Day 31: February is already underway. Too late to change anything for January.
- Day 45: You receive a report. January was okay, but Munich was 15% under plan.
- Day 46: You ask why. Answer: "Demand was just weak." → far too late to change anything for February.
With the Profit Pilot Dashboard:
- Day 1: You see in the dashboard: Munich is starting slow (35% forward occupancy for the month)
- Day 2: Dashboard shows: our team has responded – a new pricing strategy is running, a campaign is starting
- Day 5: Occupancy rises to 48%. You see the development in real time.
- Day 10: Dashboard shows a new optimization – LOS adjustment for last-minute bookings
- Day 15: Munich is now at 67% occupancy. You see why: 3 targeted measures took effect.
- Day 28: The month ends at 71% occupancy instead of the originally forecast 55%.
- Day 29: You understand exactly how we achieved this – because you followed it live all month.
You did nothing. But you saw everything.
ROI: What Does This Kind of Transparency Deliver?
It's a fair question: is transparency just "nice to have" or does it have real business impact?
Our experience from 1,200+ properties shows clear benefits:
1. Trust through traceabilityOwners who see HOW we work have significantly higher satisfaction and longer contract terms. They're not just happy with results – they understand how we achieve them.
2. Faster strategic decisionsWhen you have real-time insights, you can make strategic decisions (investments, portfolio expansion, sales) based on current data, not outdated reports.
3. Better investor communicationWhen you have to report to investors or stakeholders, you don't just have numbers – you have the story behind them. "Our revenue rose 15% because our property manager optimized A, B, and C – here you can see it live in the dashboard."
4. A proactive instead of reactive relationshipYou don't call us asking "Why was January bad?" – you've already seen and understood it in the dashboard. Conversations become strategic instead of operational.
The Three Questions You Should Ask Yourself
Before we wrap up, three questions for self-reflection:
1. When was the last time you knew DURING a month how your portfolio was performing?Not at month-end, but in the middle of it – while there was still time to react.
2. Can you watch your current property manager at work?Do you see which decisions are being made? Do you understand why?
3. How many hours do you spend "managing" your property manager?Asking questions, requesting reports, demanding decisions?
If these questions trigger frustration, the Profit Pilot model is exactly right for you.
Next Steps: Experience the Transparency Live
The best way to understand the difference is to see it.
We offer you a free Profit Analysis, in which we:
- Analyze your current situation (revenue, profit, costs - how much transparency do you have today?)
- Show you the Profit Pilot Dashboard in detail (live demo with real data)
- Walk through together what a month with our management + your transparency would look like
- Concretely calculate what impact is realistic for your portfolio
No obligation, no sales pitch – just an honest look at what modern property management with full transparency looks like.
Book your free Profit Analysis here
Conclusion: Trust Is Good, Transparency Is Better
The short-term rental market is becoming increasingly professional. The days when you could "just let your portfolio run" and get a report once a month are over.
You have two options:
Option 1: Do everything yourself. Check prices every day, analyze markets, run campaigns. That works – up to a certain point of scale. And it costs an enormous amount of time.
Option 2: Hire a property or revenue manager and hope they do a good job. That works partly too – but you're flying blind.
Arbio offers Option 3: We take over the complete operational management. You have full transparency in real time. You don't have to do anything, but you see everything.
The Profit Pilot Dashboard isn't just a technical feature. It's a fundamental difference in the way property management should work.
We steer. You see everything. Together we maximize your success.
Let's take your numbers to the next level together – with the certainty that you can follow every step.

Interested?
Let's talk about your operation.